prometheus监控系统搭建 其他参考https://blog.csdn.net/weixin_43815140/article/details/119730821
服务端安装
>服务端使用docker部署prometheus、grafana
准备文件
mkdir -p /data/docker/prometheus/server/
chmod -R 755 /data/docker/prometheus/server/
mkdir -p /data/docker/prometheus/grafana/
vi /data/docker/prometheus/server/prometheus.yml

global:
alerting:
  alertmanagers:
    - static_configs:
        - targets:
rule_files:
scrape_configs:
  - job_name: prometheus
    static_configs:
      - targets: [localhost:9090]
  - job_name: 'node_exporter-199'
    scrape_interval: 10s
    static_configs:
      - targets: ['192.168.2.199:9100'] #主机 192.168.2.199:9100
创建prometheus容器
docker run --name prometheus -p 9090:9090 --restart=always \
-v /data/docker/prometheus/server/prometheus.yml:/etc/prometheus/prometheus.yml \
-v /data/docker/prometheus/server/rules.yml:/etc/prometheus/rules.yml \
-itd prom/prometheus \
--config.file=/etc/prometheus/prometheus.yml \
--web.enable-lifecycle
创建grafana容器获取到grafana.ini后删除容器
docker run --name=grafana -p 3000:3000 -itd grafana/grafana
docker cp grafana:/etc/grafana/grafana.ini /data/docker/prometheus/grafana/
docker rm -f grafana
chmod 777 /data/docker/prometheus/*
创建正式的grafana容器
docker run -p 3000:3000 --name grafana  --restart=always \
-v /data/docker/prometheus/grafana/grafana.ini:/etc/grafana/grafana.ini \
-v /data/docker/prometheus/grafana/data:/var/lib/grafana \
-itd grafana/grafana
测试
浏览器访问:http://192.168.2.199:9090
 浏览器访问:
被监控端安装
https://prometheus.io/docs/instrumenting/exporters/ 根据需要选择监控主机资源、mysql、redis等对应的exporter。 此处以centos7系统监控为例
安装node_exporter监控主机
centos7:
https://github.com/prometheus/node_exporter
curl -Lo /etc/yum.repos.d/_copr_ibotty-prometheus-exporters.repo https://copr.fedorainfracloud.org/coprs/ibotty/prometheus-exporters/repo/epel-7/ibotty-prometheus-exporters-epel-7.repo
yum install node_exporter -y
systemctl start node_exporter && systemctl enable node_exporter
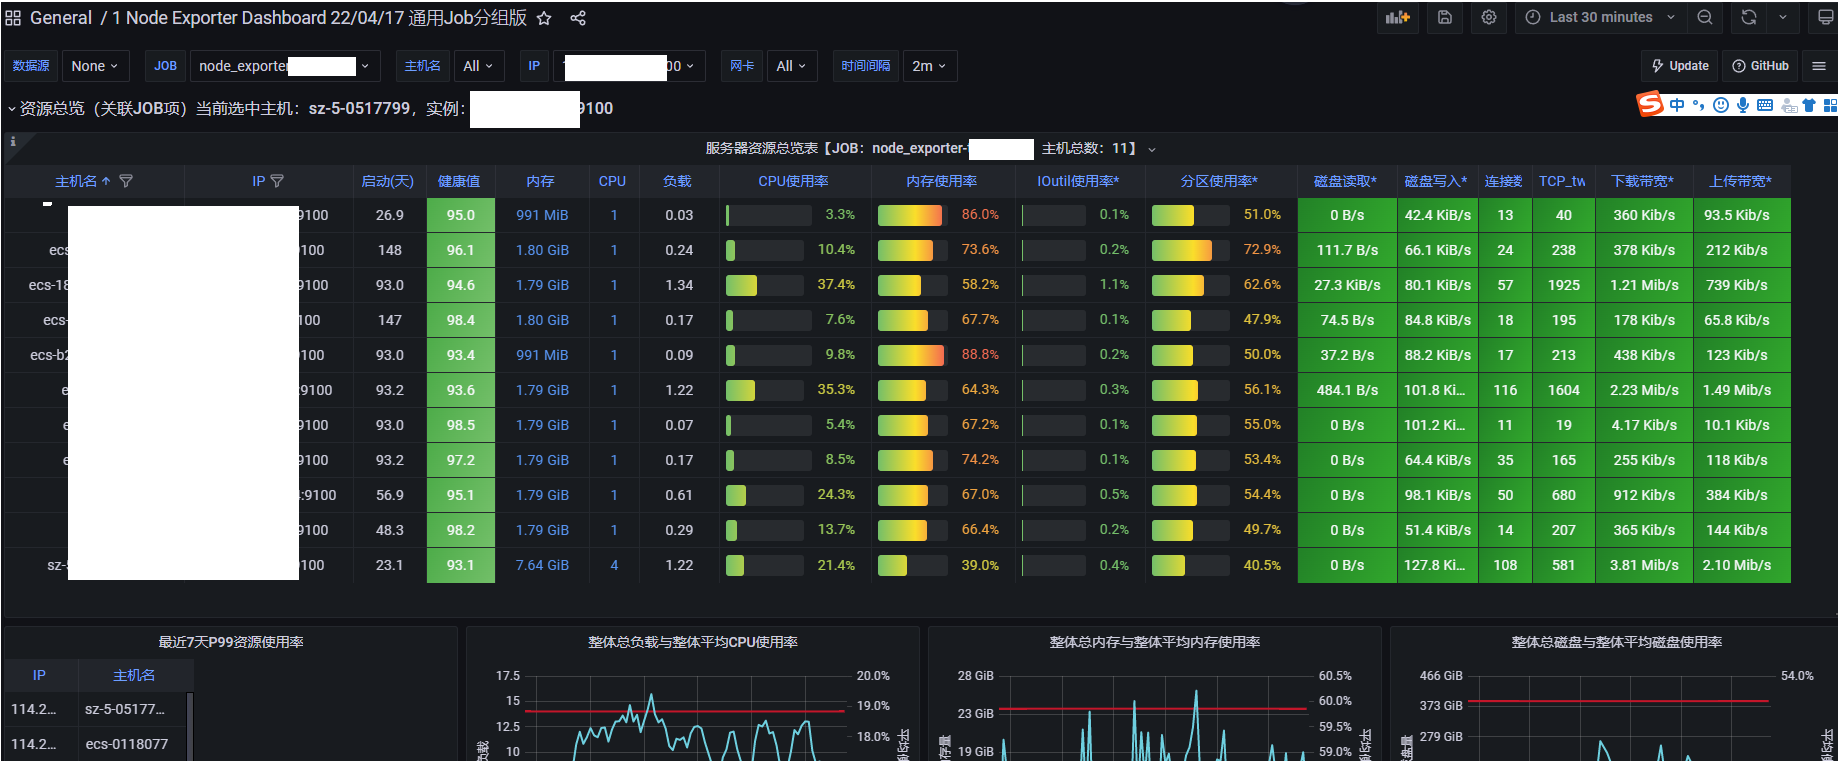
模板推荐 16098
其他主机介绍:
win主机监控 https://github.com/prometheus-community/windows_exporter/releases
#win主机模板 https://grafana.com/grafana/dashboards/10467
安装cadvisor监控主机上的docker容器
docker run -v /:/rootfs:ro -v /var/run:/var/run/:rw -v /sys:/sys:ro -v /var/lib/docker:/var/lib/docker:ro -p 18001:8080 --detach=true --name=cadvisor  google/cadvisor
模板id 1566 893 10619 11600 395 193
安装mysqld_exporter监控主机上的mysql
下载地址
    https://github.com/prometheus/mysqld_exporter/releases

mysql创建账号并授权
    CREATE USER 'exporter'@'localhost' IDENTIFIED BY 'xxx'; #mysql5.6不能用WITH MAX_USER_CONNECTIONS 3,后面手动限制下连接数
    GRANT PROCESS, REPLICATION CLIENT, SELECT ON *.* TO 'exporter'@'localhost';

创建配置/mysqld_exporter.my.cnf
    [client]
    user=exporter
    password=xxx
    host=localhost
    port=3306

运行:
    ./mysqld_exporter --config.my-cnf=/mysqld_exporter.my.cnf
    或者加入系统启动项:
        vim /etc/systemd/system/mysqld_exporter.service
        [Unit]
        Description=mysqld_exporter
        After=network.target
        [Service]
        Type=simple
        User=prometheus
        ExecStart=/usr/local/mysqld_exporter/mysqld_exporter --config.my-cnf="/usr/local/mysqld_exporter/.my.cnf"
        Restart=on-failure
        [Install]
        WantedBy=multi-user.target

修改配置:
    /data/docker/prometheus/server/prometheus.yml添加:
    - job_name: 'mysql'
    scrape_interval: 10s
    static_configs:
      - targets: ['xx:9104']

重启容器prometheus
安装nginx_exporter监控主机上的nginx
下载
    https://github.com/nginxinc/nginx-prometheus-exporter/releases

确认是否有nginx_stub_status模块
    nginx -V 2>&1 | grep -o with-http_stub_status_module

添加nginx配置
    server {
    listen   123;
    location /nginx_status {
        stub_status on;
        access_log off;
        allow 127.0.0.1;
        deny all;
        }
    }

启动
nginx-prometheus-exporter -nginx.scrape-uri http://127.0.0.1:80/nginx_status &

修改配置:
/data/docker/prometheus/server/prometheus.yml添加:
- job_name: 'nginx_status_module'
  metrics_path: '/metrics'
  scrape_interval: 10s
  static_configs:
  - targets: ['127.0.0.1:9113']

重启容器prometheus
配置
grafanas设置数据源为prometheus ,docekr部署的注意下图ip
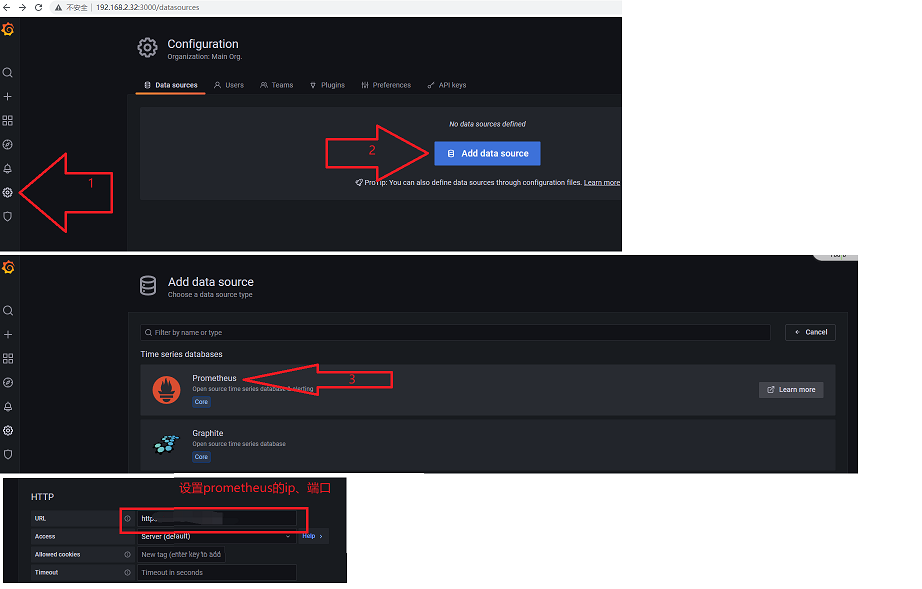
prometheuss设置exporters
vim /data/docker/prometheus/server/prometheus.yml
添加如下:
- job_name: 'node_exporter-1'
  scrape_interval: 10s
  static_configs:
    - targets: ['192.168.2.xx:9100']
重启prometheuss容器
docker restart prometheuss
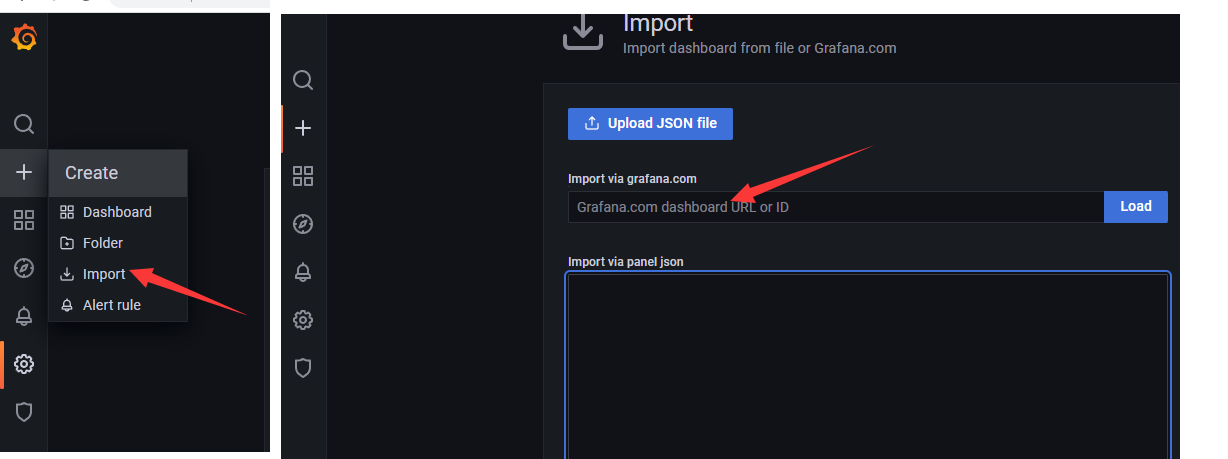
grafanas导入模板
下图输入位置,输入8919,8919是别人做的中文的主机监控模板,
https://starsl.cn/article/8919.html
推荐使用id为16098的模板,效果直观,对应效果图如下